Wednesday, April 30, 2014

Monitoring Settings in SharePoint Central Administration

In the Central Administration UI there are several different options related to monitoring your Farm. It's important to know what goes where, especially for those of you taking the 70-331 exam.

Let's think of it in terms of answering questions!

Video Format:
https://www.youtube.com/watch?v=Z5WG05c09lk

Text Format:


To answer these questions:
  • What errors or information goes into the Trace Logs (Unified Logging Service) and Windows Event Logs?
  • Where are the Trace Logs?
  • How long do I keep Trace Logs? 
  • How large can the Trace Logs be?
  • Is Event Flood Protection enabled?
Open "Configure Diagnostic Logging"

That takes you here:
For more on Diagnostic Logging and Trace Logs look here:
http://majorbacon.blogspot.com/search/label/ULS


To answer these questions:
    • Is Usage Data Collection enabled?
    • What Usage Events am I logging?
    • Where is teh Usage Data Collection Log located?
    • Is Health Data Collection Enabled?
    • What is the Health Data Collection schedule?
    • What is the Log Collection Schedule (the process that retrieves the usage log files and puts them into the database so that they can be processed for reports)
    • What is the Usage and Health Logging Database and Server (and credentials)?
     Open "Configure Usage and Health Data Collection"


     Which will take you here:


    Notice that by default Usage collection is disabled! That is good for performance, but means that you are not tracking any Web Analytics - how our system is actually being used.

    What if you want to change your SQL server or database? Never fear, it just has to be done in PowerShell:
    Set-SPUsageApplication -DatabaseServer <DatabaseServerName> -DatabaseName <DatabaseName>

    You can quickly enable or disable usage logging using PowerShell too:
     Set-SPUsageService -LoggingEnabled 1|0

    To answer the questions:
      • What are my slowest pages?
        (assuming you have already enabled usage and health data collection)
      • Who are my top active users?
       Open "View Health Reports"

      Which will take you here:


      To answer the questions:
      • What kind of bandwidth is being used?
      • What kind of File IO am I experiencing?
      • Where is all my usage and health data?
       Open "View Administrative Reports"

      Which will take you here:

      To answer the questions:
        • What SharePoint Errors in Security, Performance, or Configuration are available to detect?
        • Is a particular Rule Enabled and Schedule Correctly?
        • Will a Rule attempt to fix a problem automatically?

        Open "Review Rule Definitions"


        Which opens this:
        Which lists each Health Analyzer Rule which you can edit to manage the schedule and enabled aspects like this:

        To answer the question:

        • What Security, Configuration, or Performance Health Rules is SharePoint wanting to notify me of?


        Open "Review Problems and Solutions"

        Which will open this:

        You can open a problem to view the issue and potential solutions, and after fixing you can Reanalyze to remove the item from the list of problems


        To answer the questions:

        • What SharePoint timer jobs (like scheduled tasks) are enabled/disabled?
        • What is a job's schedule?
        • Where do I go to manually start a scheduled job?

        Open "Review Job Definitions"


         Which will take you here:


        Note the important filtering options to see service or web application specific jobs

        Select a job to view the job detail, manage the schedule, or run immediately.

        Finally,
        To answer the questions:

          • What jobs are scheduled
          • What jobs are running
          • What jobs have errored?

          Open "Check Job Status"


           Which will open the list of Timer Jobs with relevant lings to what is Schedule, Running, and the Job History of success or failure in the past:


          Well gang, I hope this clears up some of the questions you might have here in the Monitoring section of SharePoint Central Administration

          Correctly configuring the Diagnostic Levels in SharePoint 2013

          When things aren't going right and you post your problem to the forums, what do they always say? Check the logs! That's because you can use SharePoint 2013 Unified Logging Service (ULS) logs when troubleshooting. But... there are a lot of ways to configure those logs and for the 70-331 exam and the real world, you will want to take a look at some best practices:

          Change where the server writes logs.
          By default, SharePoint 2013 writes diagnostic logs to the installation directory, ie "%CommonProgramFiles%\Microsoft Shared\Web Server Extensions\15\Logs"
          Logs take space, and it would be pretty awful if you were resolving a SharePoint issue by enabling more logging only to cause additional problems because of your logging! Therefore, we should configure logging to write to a different drive by using the following PowerShell command:

          Set-SPDiagnosticConfig -LogLocation <PathToNewLocation>


          Note: The location that you specify must be a valid location on all servers in the server farm, and watch out for slow connections to network disk paths, especially if you enable verbose-level logging

          Define a maximum for log disk space usage.
          How much of your disk will the logs use? Imagine Sesame Street's Cookie Monster is the ULS logging service and your disk is a cookie. ULS logging in unrestricted by default in disk consumption. So the best practice is to restrict the disk space that logging uses, especially in verbose-level logging situations, so that when reaching maximum defined capacity the ULS service will remove the oldest logs before it recording new log data.
          Configure logging restrictions using the following PowerShell commands:
          Set-SPDiagnosticConfig -LogMaxDiskSpaceUsageEnabled
          Set-SPDiagnosticConfig -LogDiskSpaceUsageGB <UsageInGB>


          These two settings can be done in central administration in "Configure Diagnostic logging" settings
          Also, don't forget that you can enable Event Flood Protection to suppress repeated events from overflowing a log that is configured to be circular

          Set-SPDiagnosticConfig -EventLogFloodProtectionEnabled


          Choose your ULS logging levels carefully, especially Verbose
          Also called "event throttling" this is where you choose the depth of data collection for the ULS (trace logs) and the event logs. The Trace Log levels are described below.

          Typical Production settings will max out at collecting Medium Logging. Minimum Logging would be "Unexpected" Maximum Logging is Verbose which records every action, quickly eating drive space. Use verbose-level logging to record detail when making critical changes and then reset to a lower logging level.


          Similar precautions need to be taken for the Event Logging Levels:


          To Set Event Throttling use Diagnostic Logging in Central Administration or the PowerShell cmdlets:
          To set all levels:
          Set-SPLogLevel -EventSeverity <level>
          Set-SPLogLevel -TraceSeverity <level>

          To set both for one category you could use the following
          Set-SPLogLevel -EventSeverity <level> -TraceSeverity <level> -Identity "<category>"

          For example:
          Set-SPLogLevel -EventSeverity warning -TraceSeverity high -Identity "Search"


          Regularly back up logs.
          Diagnostic logs contain important data. Therefore, back up the logs regularly to ensure that this data is preserved. Use your backup software against the log directory.

          Read the Logs:
          Viewing the Logs: You can use Windows PowerShell to filter the data, display it in various ways, and output the data to a data grid with which you can filter, sort, group, and export data to Excel 2013.

          Get all the logs: (tmi!)

          Get-SPLogEvent

          Get filtered Log info: 

          Get-SPLogEvent | Where-Object {$_.<eventcolumn> -eq "value"}

          By area:
          Where-Object {$_.Area -eq "SharePoint Foundation"}


          By level:
          Where-Object {$_.Level -eq "Information" }


          By category:
          Where-Object {$_.Category -eq "Monitoring"}


          Search for text:
          Where-Object {$_.Message -like "people"}


          Output to a graphical grid - use the filtered search then pass results to out-gridview cmdlet
          Get-SPLogEvent | Where-Object {$_.Area -eq "Search"} | Out-GridView


          Of course you could also download the ULS viewer from codeplex to aid in viewing logs. More info on that here: 
          http://majorbacon.blogspot.com/search/label/ULS

          Happy Logging!
           

          Tuesday, April 15, 2014

          Majorbacon's Quick Important Shortcuts for the Cisco CLI

          I wanted to share four things that speed up my use of the Cisco CLI.

          The first three tricks are associated with register context. In order to perform command you have to enter the correct context first. Global, Global Configuration, Specific Configuration (like VLAN, Router, Interface, Line, etc.) Sometimes being in the wrong context slows you down, and these tricks help speed you back up again.

          1) Get Global

          If you are in a sub-interface level command, you can enter a different sub-interface without returning to the parent interface.
          For example:
          (config)# interface fa 0/0
          (config-if)#
          ip address 192.168.1.1 255.255.255.0
          (config-if)#
          interface fa 0/1
          (config-if)#
          ip address 192.168.2.1 255.255.255.0
           - notice that there was no exit command between the second and third steps.
          Another way to avoid the exit in a sub-interface mode is to type a global configuration command without exiting first - really that's what you did a moment ago - you called for a global config command to enter a sub-interface without leaving the interface first. But you can enter any global config command you want!
          For example:
          (config)# interface fa 0/0
          (config-if)# 
          ip address 192.168.1.1 255.255.255.0
          (config-if)#
          hostname Router1
          (config)#
           - Notice that the router rip command, a global configuration was issued without leaving the sub-interface context, and then I was left at the global level. Be aware that tab-completion and ? help will not work across contexts.

          2) Do the "Do"

          If you are in any configuration mode and wish to issue a command from the enable mode, such as all the show and debug commands, you can do so with the "Do" command. You remain in your config mode, but get the results from the enable mode.
          (config)# interface fa 0/0
          (config-if)# 
          ip address 192.168.1.1 255.255.255.0
          (config-if)# 
          no shutdown
          (config-if)#
          do show ip int briefInterface  IP-Address    OK?  Method    Status       Protocol
          S0          unassigned   YES  unset     admin down    down
          Fa0/0      192.168.1.1   YES  unset     up             up
          (config-if)#
          -notice that with the do command I was able to verify what I had done at the interface level, saving myself from typing the exit command, the configure terminal command, and the interface fa 0/0 command!

          3) Sanity Check!

          Translating "undegub"... domain server (255.255.255.255)

          One of the more annoying behaviors on a Cisco device is when you completely fat-finger it and then the entire device pauses for a good minute as though to punish you for your error with a strange 255.255.255.255 message.
          This also can happen when you are in the wrong context and it doesn't recognize your command there.

          This is because by default, when you enter an unrecognized command the router believes that this must be a host name of a device you want to telnet to! Assuming you haven't defined a DNS server in the configuration the router will issue a broadcast for the command to be translated into an IP address. Waiting for broadcasts to fail takes several seconds for the router. (Waiting for broadcasts to fail has been the bane of administrators since the dawn of time).
          The fixes: 
          1. Skip attempting look-ups altogether (you'll have to use the local hosts table if you want name resolution)
            (config)# no ip domain-lookup
          2. Or point to a valid dns server but disable dynamic lookup
            (config)#
            ip name-server 8.8.8.8

            (config)# line vty 0 15
            (config-line)# transport preferred none
           

          4) Where do I "begin"?

          When you show a long list, such as a mac-address-table or configuration file, it is often inconvenient to try and  find the particular place where an item is located that you want to verify. Fortunately, you can pipe your show command into a begin statement that will actually find what you are looking for and start your results there!
          For example:

          Router1# show running-config | begin line
          Building configuration...
          line con 0
            transport input none
          line aux 0
          line vty 0 15
          !
          no scheduler allocate
          end


          So - I hope these tools will help you use Cisco's CLI with greater speed and agility, so you can spend less time scanning and more time doing!


          Changing default permissions to active directory objects via the Schema

          Maybe you want your delegated admin or help desk team to have the ability to manage user account objects throughout active directory, but you don’t want to make them members of the domain admins group. You could delegate authority to this group at a domain or ou level. Likewise you may want certain groups to be able to manage all group policies without having to give them special permissions, or, again, without making them domain administrators. Again, you could use the delegation of control wizard or security tab to set permissions that will be inherited by all objects of this type at the domain or OU level. Or…
          You could do what Microsoft has already done, and assign default permissions to objects based upon their schema class type. These default permissions can be easily removed without breaking inheritance, which can be a better model for some administrators. One word of warning: these changes are made forest-wide – so all the domains will be creating objects with these permissions in place. In a multi-domain environment this could be just what you wanted (central management) or absolutely the wrong thing (cross-domain security breach). If it’s just too widespread, you’ll need to use active directory delegation tools instead of default permissions.

          To do this, you will need to be logged in as a member of the schema administrators group, a group that by default has only the default administrator account as a member.

          Note that being a member of the Enterprise administrators group member is not the same thing as being a Schema Admins group member.
          •  Enterprise Admins = Configuration (Sites/Trusts/New Domains) and Domain Directory partitions (Users/OUs/Computers)
          •  Schema Admins = The Schema partition of Active Directory that defines objects and attributes and default permissions
          After installing the administrative tools (download RSAT), you will have all the default active directory tools on your desktop, but no tool for schema.
          First you will need to register the schema management console from the cmd or runline using: regsvr32 schmmgmt.dll


          You will need to create a new MMC console (go to the start or run line, type mmc, and press enter) and then add the Schema snap-in (file to add/remove snap-in, click add, choose Active Directory Schema).
           

          Then you will need to open the classes object and find the object class you are looking for. Users are easy (it’s called users) and Group Policy Objects are too (They are called groupPolicyContainers). In the properties for the object, there is a default security tab which you can use to set the default permissions for new objects based upon this schema class. In the following example I have added Help Desk to the default permissions group for Group Policy Containers.


          Warning: you won’t see the change until

          1. You restart the Netlogon service
          2. This has replicated to all the domain controllers in your forest. 
             
          You can make these permissions apply to existing objects by going to the security tab of an AD object, going to advanced, and clicking default, which will set the local permissions to the schema default values. In the following example you can see how in the properties of a group policy after I click Restore Defaults you can see the help desk group added to the permissions list.

          Good Luck!!!

          How do I change the Content Type Hub URL?


          The URLof the content type hub cannot be changed from UI of ShaerPoint Central Administration once we have the Managed MetaData Service (MMS) application created.

          We can however still change it by using Powershell! (Of Course)

          You'll need to know two pieces of information: What is the administrative name of your managed metadata service and what is the new URL you want to serve as the content type hub.

          Then just launch the SharePoint Management Shell as an administrator and execute the following:

          Set-SPMetadataServiceApplication -Identity "<ServiceApplication>" -HubURI "<HubURI>"
          So in my my example it would look like this:
          Set-SPMetadataServiceApplication -Identity "CORP Managed Metadata" -HubURI "http://intranet.corp.brocadero.com/contentHub"

          Then answer Yes to the prompt and you're golden! Here's the verification in the UI:


          Problem solved. Have a great day!

          Using LDAP Saved Queries for Active Directory

          In Active Directory, if you have more than one account in the same container, you can mass select them by CTRL+Clicking or SHIFT+Clicking them.  Once selected as a collection (I will refrain from using the term "group" in order to avoid "confusion"), you can enable or disable them, move them into a group, or modify many of their properties at the same time.  And yes, sometimes I do the same thing with scripts in PowerShell.
          The challenge in using this ability in the GUI comes when the users that you want to manage live in different OUs, which prevents them from being selected simultaneously.   But fear not!  You can flatten the OU structure of an Active Directory domain in order to find and manage related accounts quickly by using Saved Queries!  Saved Queries will also allow you to find accounts based upon properties in a way that would otherwise be vastly time consuming.

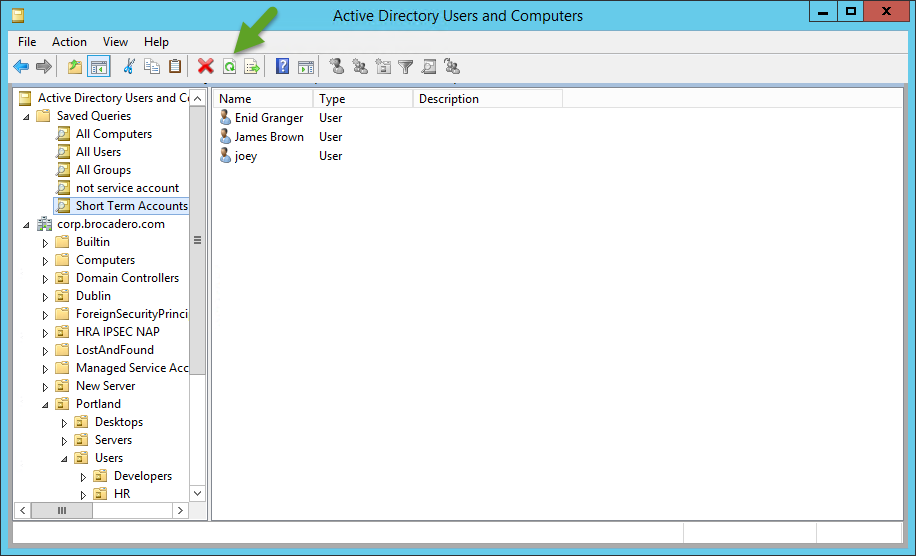
          Saved Queries are found in the Active Directory Users and Computers console.  Right click on saved queries, and create a new query. 

           Give your query a useful name, determine if you will limit the scope to less than the domain (perhaps an OU?) and then click "define query".

          Now you can see that anything you can find with Active Directory Find can be found and saved here. Choose "custom search" from the drop down of options at the top.
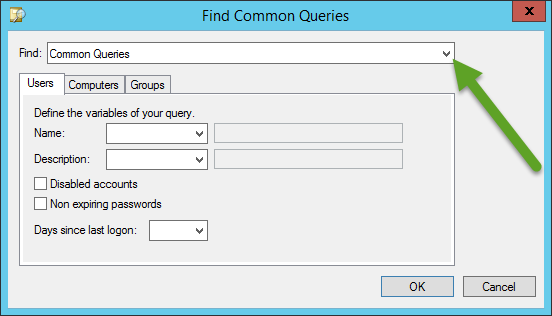
          Then go to the advanced tab, you will be presented with a blank LDAP query field.  This is where you will enter your queries.

           After clicking OK and OK, you can see your result set. You may need to click Refresh to see up to date information


           I will now present several queries for your benefit, and explain what they do.
          All Users Query: (objectCategory=person)(objectClass=user)
          This query is a simple tool that allows you to have a logical search container that finds every user, no matter what OU they are hiding in.  Now you can seek, search, and sort to your hearts content within this structure.

          Where's Bob Query: (objectCategory=person)(objectClass=user)(name=Bob)
          This query finds any user named Bob, no matter where he is hiding.  I would just use the common query tool rather than the custom query to find him, but I want you to see the syntax in order to make sense of the next query...

          Standard Users Query: (objectCategory=person)(objectClass=user)(!name=SUPPORT_388945a0)(name=*)(!name=Guest)(!name=Administrator)(!name=Krbtgt)
          So, sometimes what is important is what you DON'T want to see!  Where (name=Bob) found the account we wanted, (!name=Administrator) indicates what we want to be filtered out.  The exclamation point acts as the boolean operator "NOT" in this query.

          Disabled Users - (objectCategory=person)(objectClass=user)(userAccountControl:1.2.840.113556.1.4.803:=2)
          This query finds all disabled users by their userAccountControl value.  Again, this one would be easy enough to do with a common query, where it is just a checkbox to find these accounts.  In fact, that is exactly what I did to create this query.  But on the main query page (before the editor), you can see the LDAP query that the common query created.  Again, I can use this to look for something that is NOT a common query...

          NOT Disabled Users - (objectCategory=person)(objectClass=user)(!UserAccountControl:1.2.840.113556.1.4.803:=2)
          Once again, the exclamation point before the setting makes it invert the selection, now finding all accounts that have not been disabled.  Remember that first query that flattened all the users?  Many organizations disable accounts instead of deleting them when people leave the company.  That means that with the first query you would find tons of old user accounts.  This query eliminates them from the display.

          Locked Out Accounts - (ObjectCategory=Person)(ObjectClass=User)(LockoutTime&gt;=1)
          Finding accounts that are locked out so that they can be unlocked and have their password reset is a common issue.  Now, instead of trying to find the locked out account (which has no distinguishing icon, unlike disabled accounts), you can have Active Directory Users and Computers find it for you!

          Only Temporary Accounts that will Expire - (objectCategory=person)(objectClass=user)(!accountexpires=9223372036854775807)(!accountexpires=0)
          When an user account is created for a contract worker or temp worker, they are often given user expiration dates.  Default accounts will either have 0 or that huge number you see above as their value.  Again, this query dives in, finds the temp accounts in any region or department they may be located in, and brings them to the surface, perhaps so that you can reset their expiration date to something later, or delete or disable their account early.

          All Computers - (objectCategory=computer)
          You guessed it.  This finds all computers, no matter where they might be hiding in your AD structure.
          Used Computer Accounts - (&amp;(sAMAccountType=805306369)(objectCategory=computer)(operatingSystem=*))
          When a computer joins the domain, it populates it's own operating system field. This query uses the "*" as a wildcard character, which will find ALL operating systems, meaning that the field can be anything... except blank.

          Prestaged Computer Accounts - (&amp;(sAMAccountType=805306369)(objectCategory=computer)(!operatingSystem=*))
          When a computer joins the domain, it populates it's own operating system field.  Therefore, by searching for all users accounts where the operating system is NOT filled with anything, you can find prestaged computer accounts that are set up ahead of time by administrators to support future clients.
           You can learn a lot by using the basic queries and backsolving - even when you use a basic query the first properties sheet (before you go into define query) displays the LDAP query!


          You can also find out a great deal by configuring accounts differently and then viewing their properties in adsiedit.msc or in the advanced view ADUC properties tab.


          One last note about saved queries.  Once you create them, they are saved with the console, NOT in Active Directory.  That means other users will not be able to see them.  Even you won't be able to see them if you open a different MMC console!  Fortunately, you can right click and export them as XML files, and import them into any other MMC where needed.  You may wish to export them and have them available on a network drive... just in case.

          Good luck, and let me know if there are any saved queries that you would like to figure out!