Change where the server writes logs.
By default, SharePoint 2013 writes diagnostic logs to the installation directory, ie "%CommonProgramFiles%\Microsoft Shared\Web Server Extensions\15\Logs"
Logs take space, and it would be pretty awful if you were resolving a SharePoint issue by enabling more logging only to cause additional problems because of your logging! Therefore, we should configure logging to write to a different drive by using the following PowerShell command:
Set-SPDiagnosticConfig -LogLocation <PathToNewLocation>
Note: The location that you specify must be a valid location on all servers in the server farm, and watch out for slow connections to network disk paths, especially if you enable verbose-level logging
Define a maximum for log disk space usage.
How much of your disk will the logs use? Imagine Sesame Street's Cookie Monster is the ULS logging service and your disk is a cookie. ULS logging in unrestricted by default in disk consumption. So the best practice is to restrict the disk space that logging uses, especially in verbose-level logging situations, so that when reaching maximum defined capacity the ULS service will remove the oldest logs before it recording new log data.
Configure logging restrictions using the following PowerShell commands:
Set-SPDiagnosticConfig -LogMaxDiskSpaceUsageEnabled
Set-SPDiagnosticConfig -LogDiskSpaceUsageGB <UsageInGB>
These two settings can be done in central administration in "Configure Diagnostic logging" settings

Set-SPDiagnosticConfig -EventLogFloodProtectionEnabled

Choose your ULS logging levels carefully, especially Verbose
Also called "event throttling" this is where you choose the depth of data collection for the ULS (trace logs) and the event logs. The Trace Log levels are described below.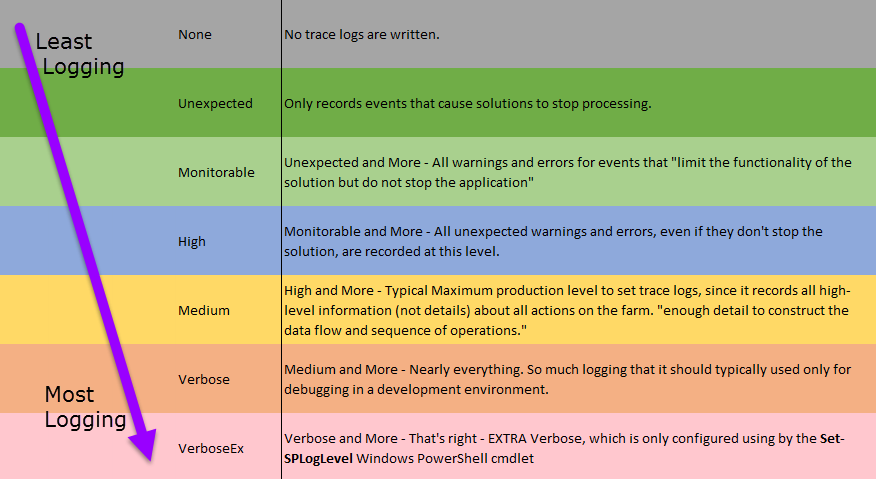
Typical Production settings will max out at collecting Medium Logging. Minimum Logging would be "Unexpected" Maximum Logging is Verbose which records every action, quickly eating drive space. Use verbose-level logging to record detail when making critical changes and then reset to a lower logging level.
Similar precautions need to be taken for the Event Logging Levels:

To Set Event Throttling use Diagnostic Logging in Central Administration or the PowerShell cmdlets:To set all levels:
Set-SPLogLevel -EventSeverity <level>
Set-SPLogLevel -TraceSeverity <level>
To set both for one category you could use the following
Set-SPLogLevel -EventSeverity <level> -TraceSeverity <level> -Identity "<category>"
For example:
Set-SPLogLevel -EventSeverity warning -TraceSeverity high -Identity "Search"

Regularly back up logs.
Diagnostic logs contain important data. Therefore, back up the logs regularly to ensure that this data is preserved. Use your backup software against the log directory.
Read the Logs:
Viewing the Logs: You can use Windows PowerShell to filter the data, display it in various ways, and output the data to a data grid with which you can filter, sort, group, and export data to Excel 2013.
Get all the logs: (tmi!)
Get-SPLogEvent
Get filtered Log info:
Get-SPLogEvent | Where-Object {$_.<eventcolumn> -eq "value"}
By area:
Where-Object {$_.Area -eq "SharePoint Foundation"}
By level:
Where-Object {$_.Level -eq "Information" }
By category:
Where-Object {$_.Category -eq "Monitoring"}
Search for text:
Where-Object {$_.Message -like "people"}
Output to a graphical grid - use the filtered search then pass results to out-gridview cmdlet
Get-SPLogEvent | Where-Object {$_.Area -eq "Search"} | Out-GridView

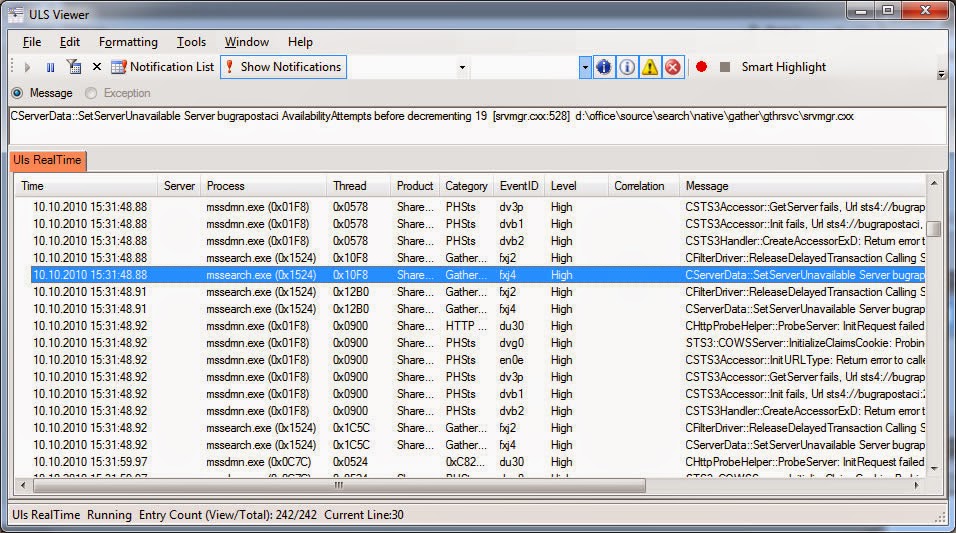
Of course you could also download the ULS viewer from codeplex to aid in viewing logs. More info on that here:
http://majorbacon.blogspot.com/search/label/ULS
Happy Logging!